


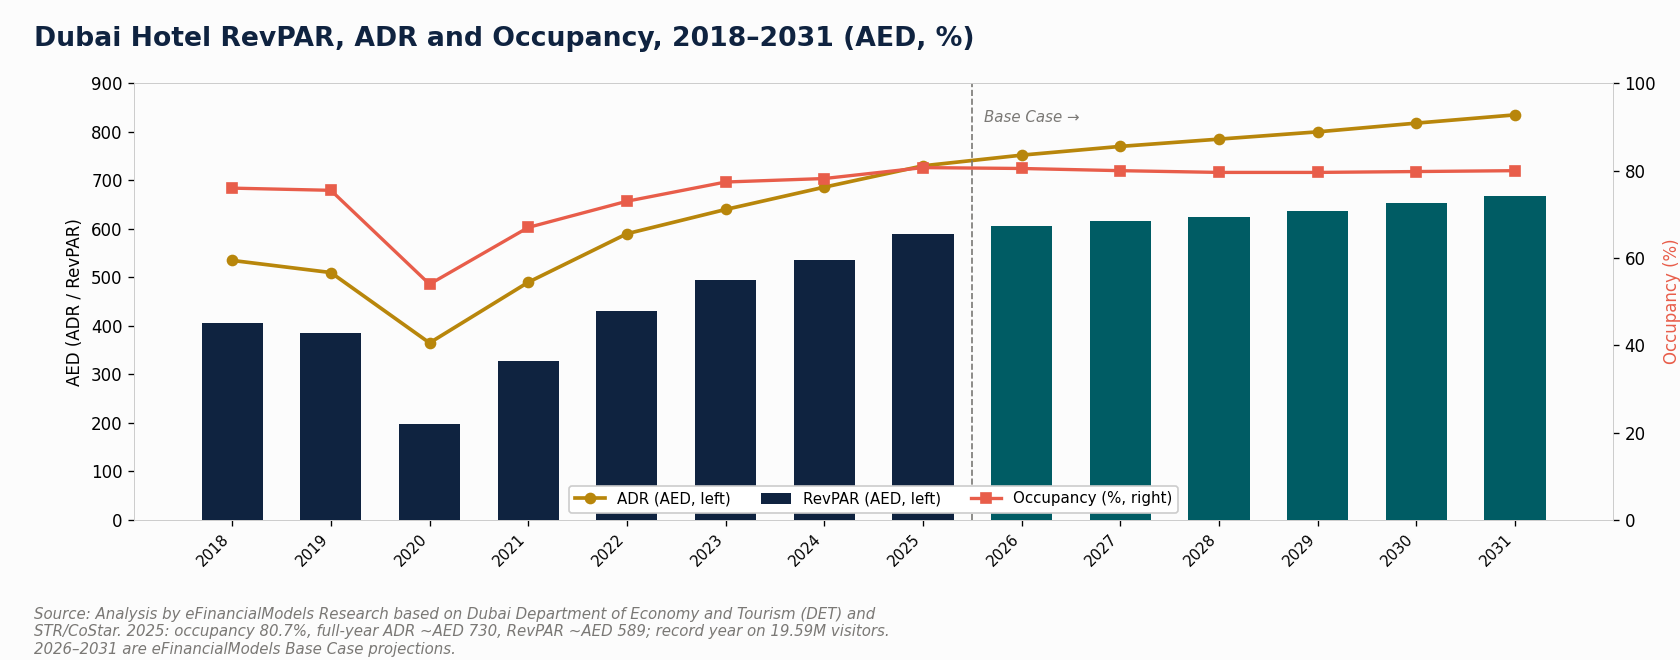
Dubai hotel ADR, RevPAR and occupancy from 2018 to 2031, with rate climbing while occupancy holds near 80%. Source: UAE Hospitality Market Study 2026-2031.
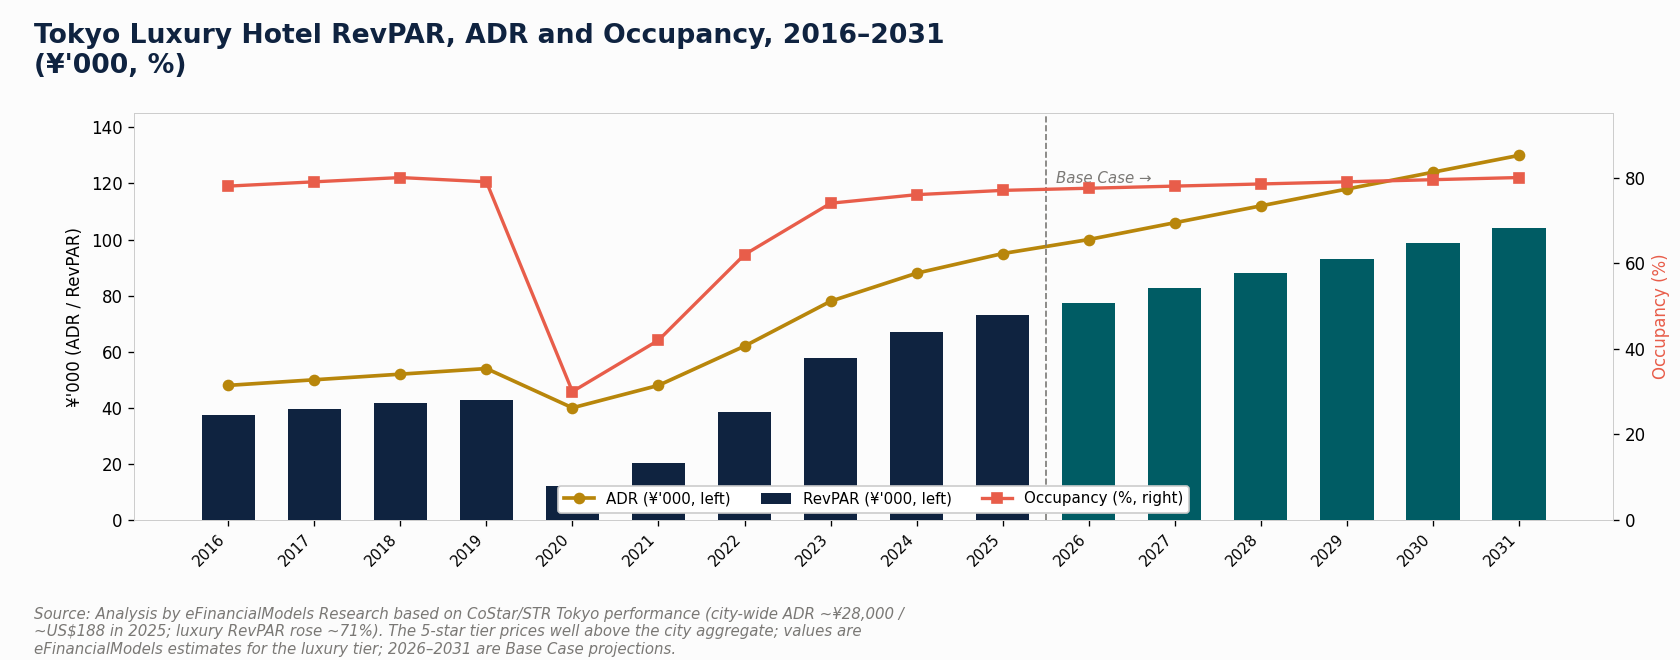
Tokyo luxury hotel ADR, RevPAR and occupancy from 2016 to 2031, with rate rising steeply while occupancy returns to its pre-2020 band. Source: Japan Luxury Hospitality Market Study 2026-2031.
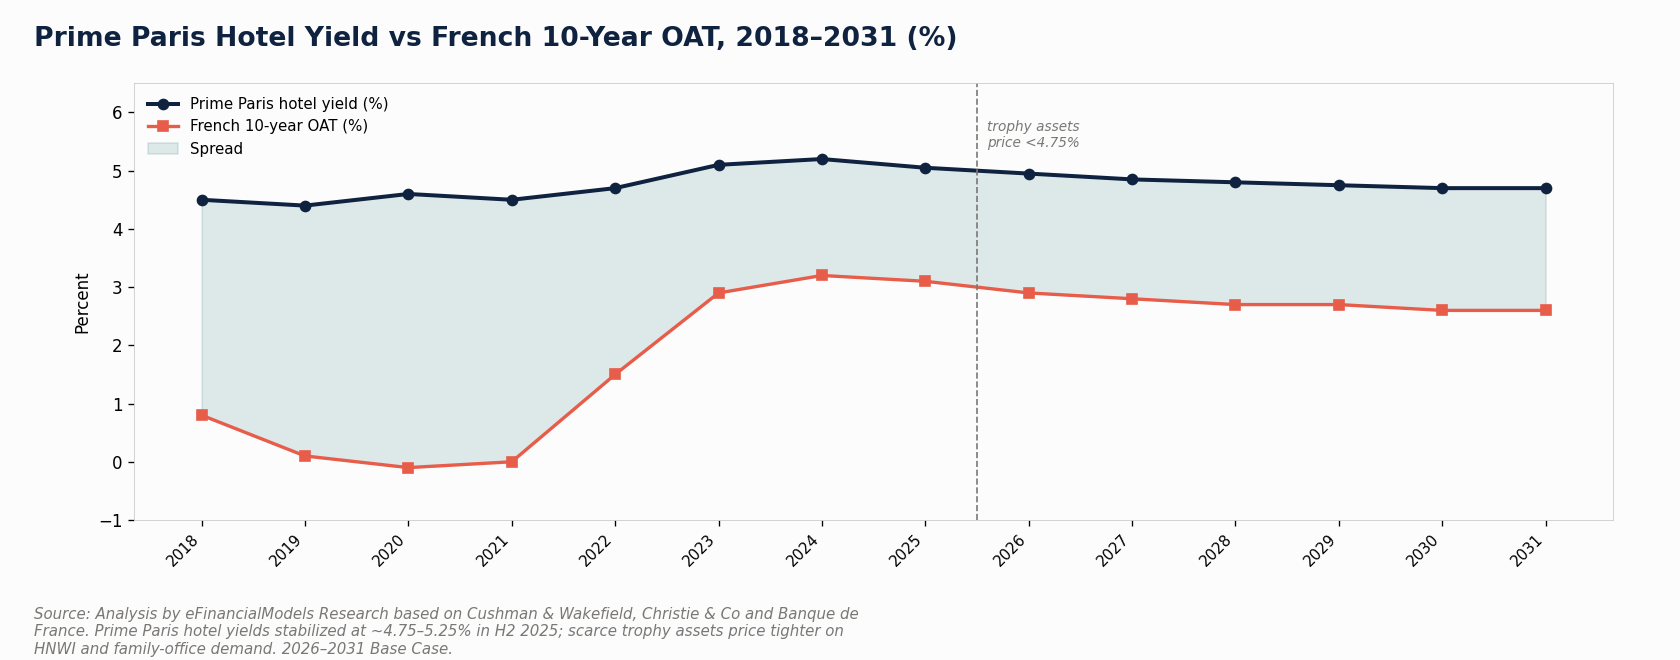
Prime Paris hotel yield against the French ten year OAT from 2018 to 2031, with the spread between them shaded. Source: France Luxury Hospitality Market Study 2026-2031.
Five eFinancialModels Hospitality Market Studies find the same mechanism in the US, France, Italy, Japan and the UAE, and five different reasons behind it.
The United States shows what rate-led looks like when volume stops helping. 2025 brought the first occupancy and RevPAR decline since 2020, at about 62.3% occupancy, ADR near $160.54 and RevPAR near $100.02, while labor cost per occupied room rose about 12.8%. The USA Hospitality Market Study forecasts 2026 RevPAR growth of roughly 0.6% to 0.9%, rate-led rather than occupancy-led. In Paris, Milan, Tokyo and Dubai the same mechanism runs at record levels.
"Rate-led is not one story, it is five," said a spokesperson for eFinancialModels. "The driver behind the rate, whether that is constrained supply, an event, a tax rule or a currency, is what sets the occupancy path and the exit assumption. A single global exit cap rate will not price these five markets. The spread is wide enough that the assumption has to be set market by market."
What the five studies show:
Regulation is doing the work in France. The Loi Le Meur, France's short-term-rental law, constrains the rental substitute while planning and energy rules limit new supply. Paris luxury RevPAR rose about 6% in the first half of 2025, and State-certified Palace properties went from 16 in 2015 to 33 in 2026. The France study treats new supply as a policy variable rather than a construction variable.
An event and a tax rule are doing it in Italy. Milan is posting record rates into the Milano-Cortina 2026 Olympics, Rome RevPAR sits near 183 euros, fourth in Europe, and Italy's neo-resident flat tax rises to 300,000 euros for 2026, drawing relocating wealth, while the CIN registration regime constrains short-term rentals.
Currency and a national target are doing it in Japan. Tokyo rates have risen more than 20% for 19 straight months, pulled by a weak yen and a 60 million visitor target for 2030, while Kyoto's tenfold accommodation-tax rise and tighter minpaku rules, Japan's limits on home-sharing, add cost and remove the substitute. Prime Tokyo hotel yields sit near 3.0% to 3.5%, the tightest of the five markets.
Mix, not scarcity, is doing it in the UAE. Dubai ran about 80.7% occupancy in 2025 on full-year ADR near AED 730, with December ADR near AED 1,042, because resort assets price on a steep winter-peak curve. Dubai supply still grows about 5.6% a year, luxury at about 61% of new 2026 supply, and the UAE study's base case carries seasonal ADR and occupancy paths rather than annual averages.
In the United States the extended-stay segment defends margin through cost rather than rate. It runs about 1.30 labor hours per occupied room against 1.80 for full-service, and about 46% gross operating margin against 28%. It now holds more than 611,000 rooms and about 40% of the construction pipeline by project count.
The capital assumption diverges further than the revenue one, and the studies show why: four of the five price their market against its own sovereign benchmark. Prime yields run near 3.0% to 3.5% in Tokyo against the Japanese JGB, about 3.8% net in Milan and 4.3% net in Rome against the Italian BTP, and roughly 4.75% to 5.25% in Paris against the French OAT. US hotel cap rates, a broader measure across asset quality, sit near 10% against a 10-year Treasury near 4%. The UAE study instead sets prime resort assets, at an indicative gross 4% to 5%, against an investor target near 8% to 9%.
Read together, the five studies turn one ADR growth line into five assumption sets, each with its own occupancy path, labor cost per occupied room and exit cap rate to forecast against.
All five Hospitality Market Studies can be downloaded free of charge, and the assumptions can be applied directly in the eFinancialModels hotel financial model templates.
Editor's note: The series also covers Spain, Thailand and the Maldives. Forward-looking figures for 2026 to 2031 are eFinancialModels Base Case projections, labeled as such in each study.
Communications Team eFinancialModels
eFinancialModels
info@efinancialmodels.com
Visit us on social media:
LinkedIn
Bluesky
Instagram
Facebook
YouTube
TikTok
X
Legal Disclaimer:
EIN Presswire provides this news content "as is" without warranty of any kind. We do not accept any responsibility or liability for the accuracy, content, images, videos, licenses, completeness, legality, or reliability of the information contained in this article. If you have any complaints or copyright issues related to this article, kindly contact the author above.
